In addition to creating several Tableau dashboards on financial trends, engineering review processes, container vulnerabilities, and marketing trends, I experimented with Tableau’s annimation features when they were first released in 2020. Check out some videos I made early in the pandemic. Click on any of the video images below to watch them.
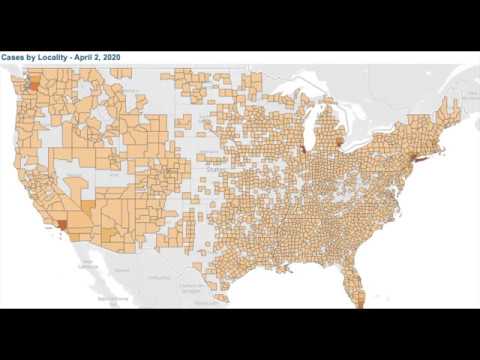
COVID-19 Surge, February 2021
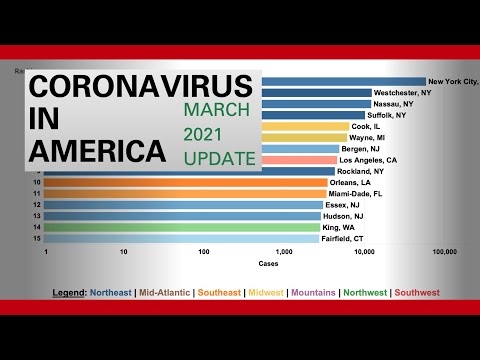
Top 15 Hardest Hit Areas in the United States by COVID-19, May 2020
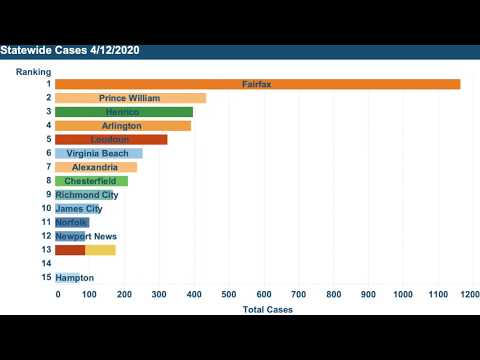
Top 10 Hardest Hit Areas in Virginia by COVID-19, April 2020